
Click HERE For information on the methodology and background behind the process of our 4th Quarter Win % over Expectation research.
2025 Results Summary:
2025 Overachiever Results:
The Following Teams were considered Overachievers by our metric in 2024 heading into the 2025 season:
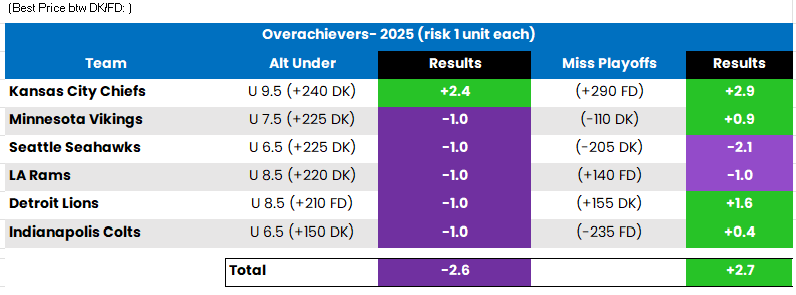
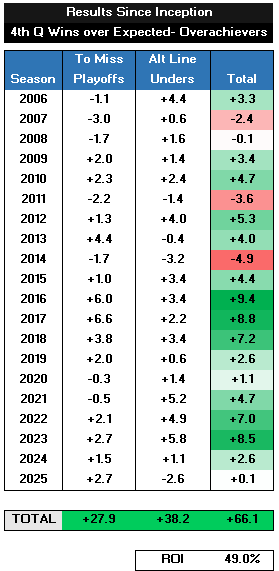
For the 11th straight season and 13 of the last 14, this basket of overachievers delivered positive returns (Barely!). The Chiefs going well under their win total and missing the Playoffs were the biggest winners of this basket of overachievers. The Lions missing the Playoffs was also a nice hit although their week 18 finale win in Chicago was the difference in the overall results of this basket returning a larger ROI. 2025 was the first year since 2014 where the alternative win total unders returned a loss.
2025 Underachiever Results:
The Following Teams were considered Underachievers by our metric in 2024 heading into 2025:
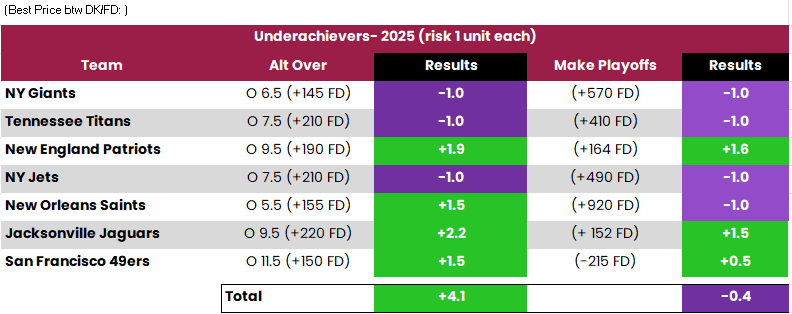
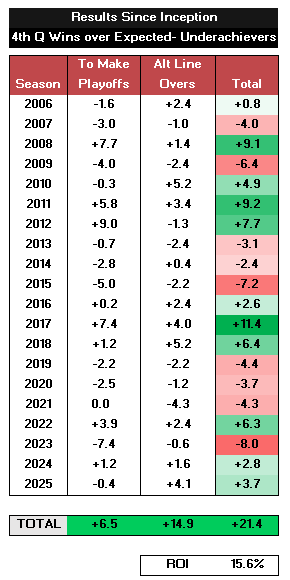
The underachiever basket returned a 2nd straight positive outcome. It has been a choppy last decade with some enormous positive outcomes (+17.8 units in 2017-2018) as well as really negative outcomes (-14.1 units between 2019-2023). By nature of the composition of this basket of longer shot underachievers to make the Playoffs, it is only natural that there is extreme volatility from year to year.